2025 Stock Performance of Top Pharmaceutical Companies: January 2–December 1

Overview
As 2025 enters its final stretch, equity performance across large pharmaceutical companies shows a pronounced divergence. The gap between the strongest and weakest performers in this selected group reached 87.2 percentage points between January 2 and December 1. Notably, Eli Lilly was not the top stock performer over this period.
This analysis summarizes stock price changes for selected global pharmaceutical companies and places them alongside portfolio and clinical developments during the period.
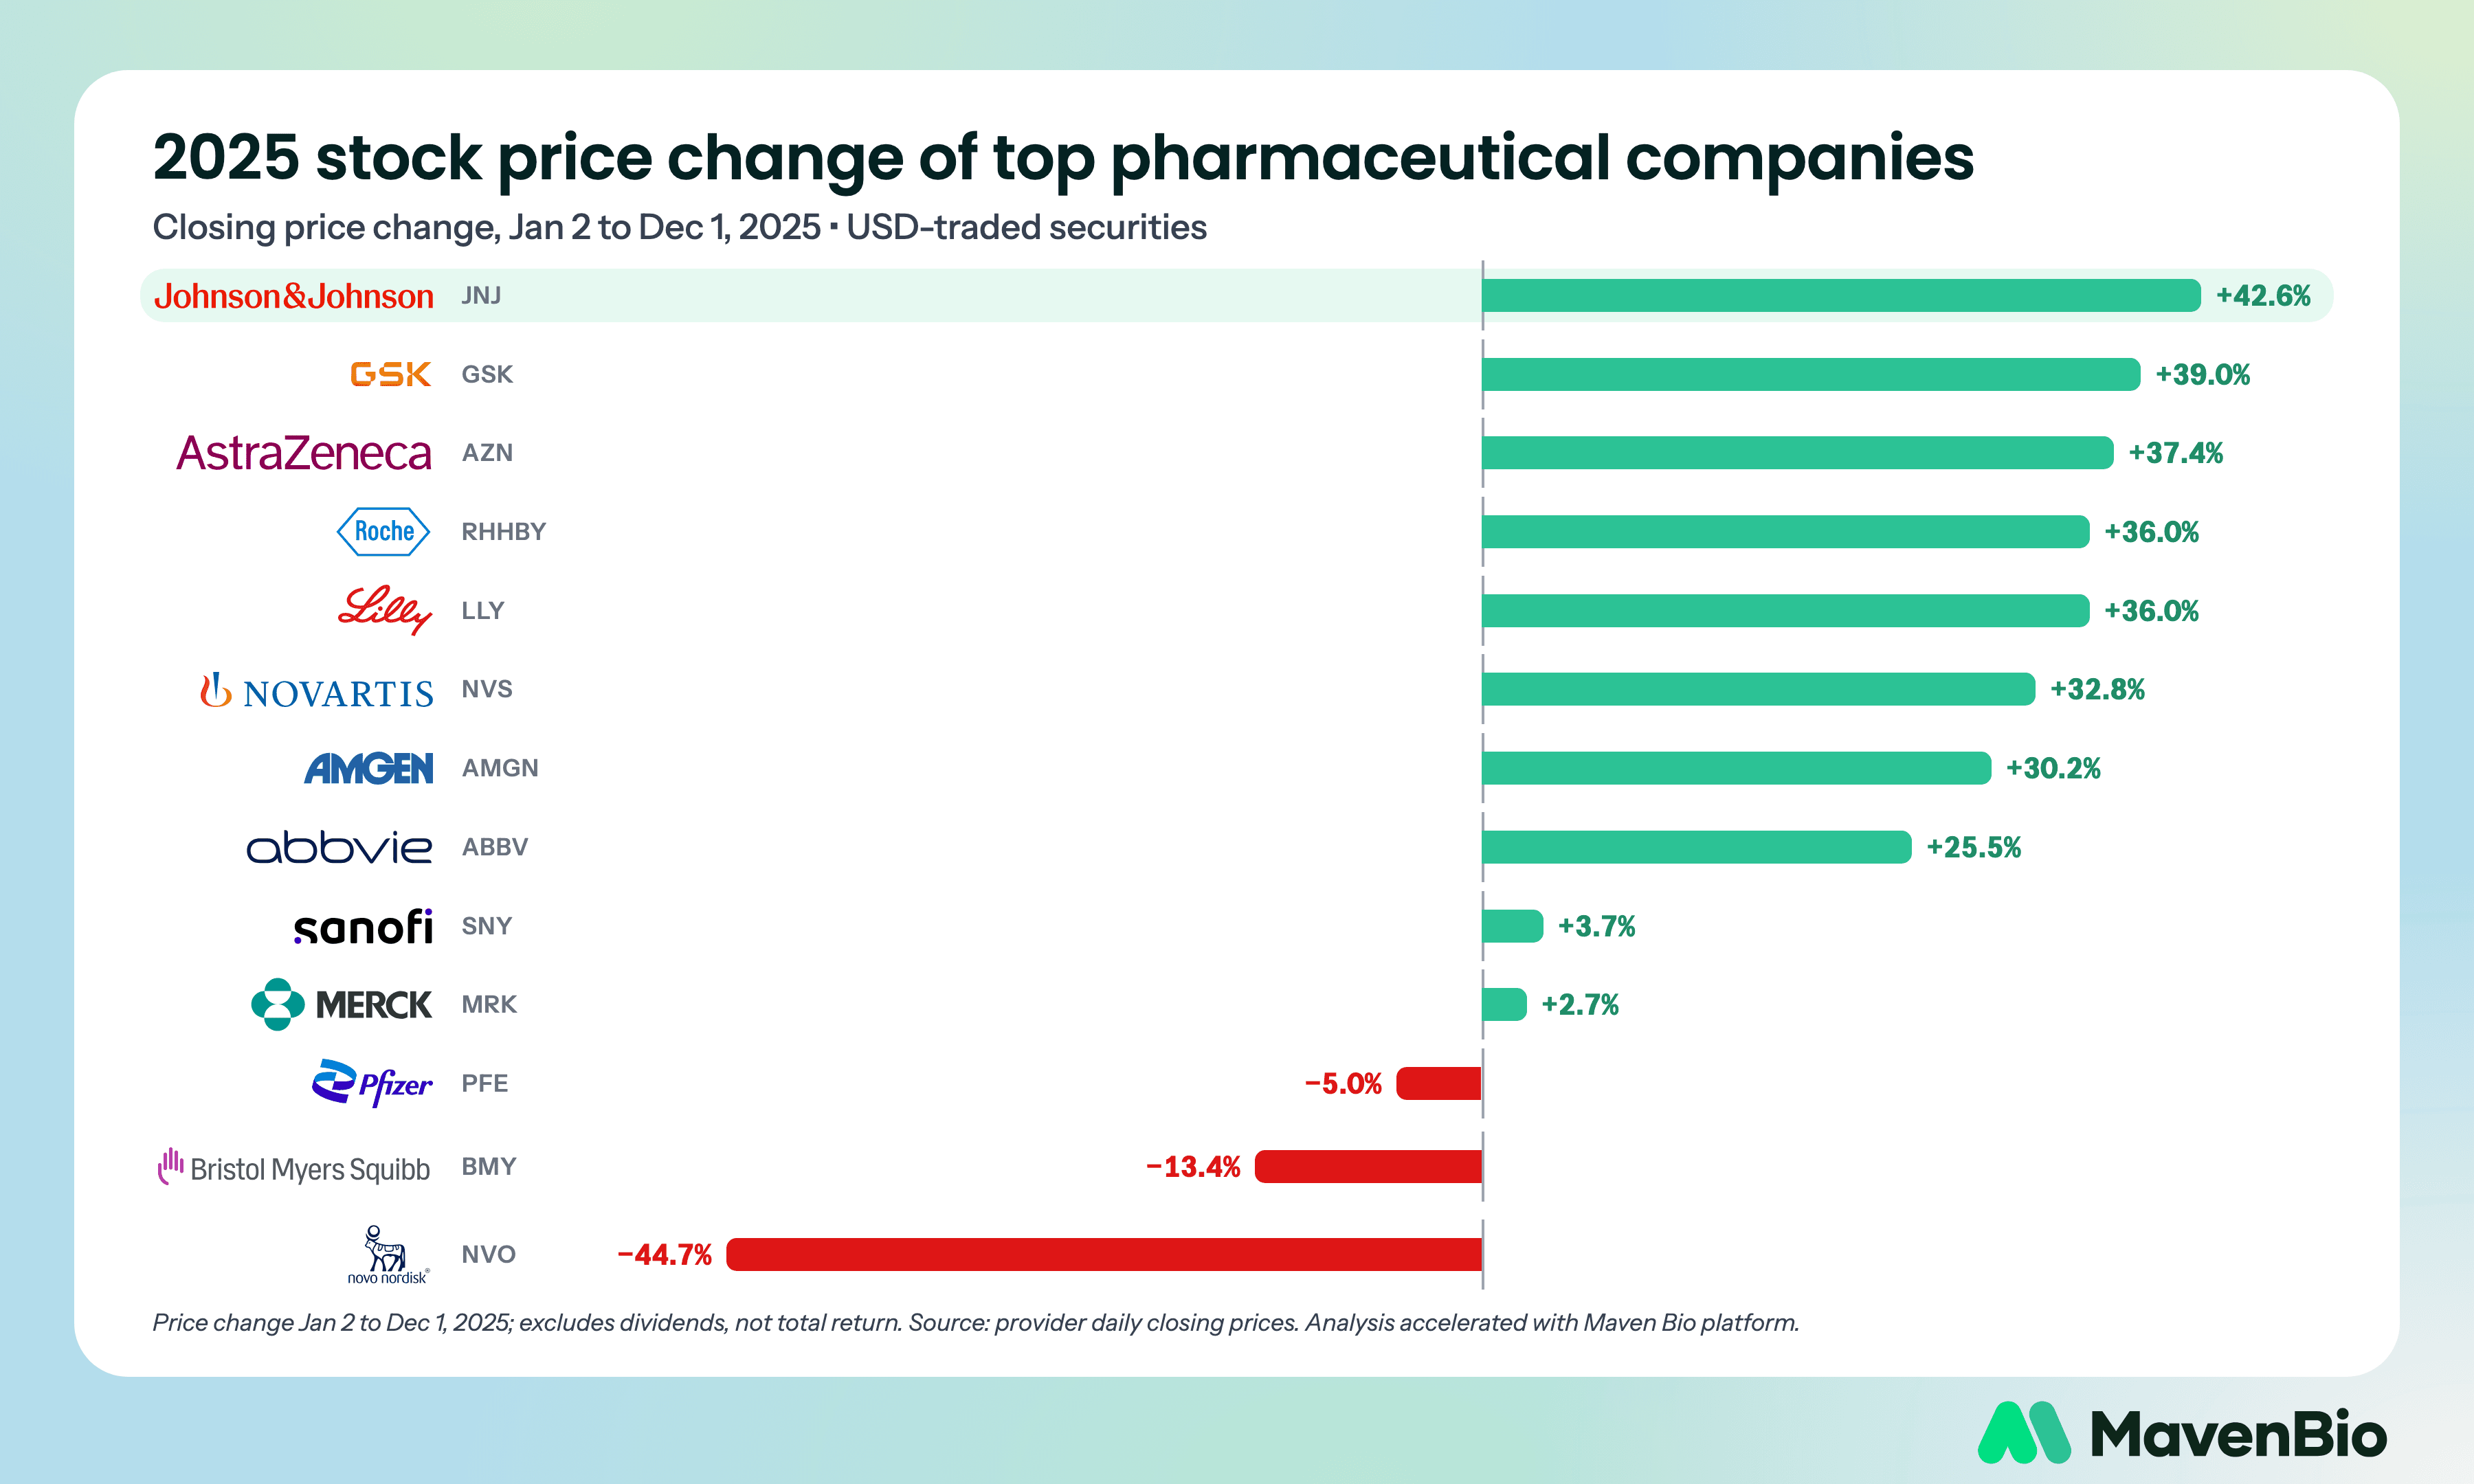
2025 Stock Price Performance: January 2–December 1
Stock price change is calculated as (December 1, 2025 closing price ÷ January 2, 2025 closing price − 1) × 100, using Yahoo Finance's Close series for the U.S.-traded securities listed below. All prices are in U.S. dollars and exclude dividends; this is price return, not total return. The January 2 closing baseline differs from conventional year-to-date measurement, which begins at the prior December 31 close. Rankings use unrounded returns. AstraZeneca's prices are shown on the 2025 ADS scale, with two ADSs per ordinary share; the constant scale adjustment does not change its return. ADR returns can differ from local-share returns because of currency movements. The original article did not identify its listings; the U.S.-traded securities shown here are reconstruction assumptions, not confirmed original selections.
| Company / ticker | 2025 listing | Jan 2 close ($) | Dec 1 close ($) | Price change |
| Johnson & Johnson / JNJ | NYSE | 144.02 | 205.34 | +42.6% |
| GSK / GSK | NYSE | 33.95 | 47.19 | +39.0% |
| AstraZeneca / AZN | Nasdaq (2025 ADS) | 65.88 | 90.52 | +37.4% |
| Roche / RHHBY | OTC Markets OTCQX | 34.94 | 47.51 | +36.0% |
| Eli Lilly / LLY | NYSE | 778.07 | 1057.89 | +36.0% |
| Novartis / NVS | NYSE | 97.14 | 128.97 | +32.8% |
| Amgen / AMGN | NasdaqGS | 259.28 | 337.49 | +30.2% |
| AbbVie / ABBV | NYSE | 179.44 | 225.11 | +25.5% |
| Sanofi / SNY | NasdaqGS | 48.19 | 49.95 | +3.7% |
| Merck / MRK | NYSE | 99.17 | 101.83 | +2.7% |
| Pfizer / PFE | NYSE | 26.61 | 25.27 | -5.0% |
| Bristol Myers Squibb / BMY | NYSE | 56.79 | 49.18 | -13.4% |
| Novo Nordisk / NVO | NYSE | 87.52 | 48.43 | -44.7% |
Data sources: JNJ prices GSK prices AZN prices RHHBY prices LLY prices NVS prices AMGN prices ABBV prices SNY prices MRK prices PFE prices BMY prices NVO prices AstraZeneca ADS conversion GSK belrestotug update DESTINY-Breast05 results J&J MARIPOSA-2 approval (2024) Lilly Zepbound pricing Novo CEO transition Novo workforce plan Pfizer–Metsera completion Novo evoke/evoke+ results BMS 2024 annual report
Top Performers: Diversification, Visibility, and Clinical Momentum
Johnson & Johnson led the group with a 42.6% price gain. Its diversified pharmaceutical portfolio included oncology assets such as Darzalex, Tecvayli and Rybrevant, alongside immunology and neuroscience medicines. Growth in newer products helped offset declining Stelara revenue following biosimilar entry. These business developments provide context without establishing the cause of the share-price gain.
GSK followed closely with a 39.0% price gain. Vaccines and infectious diseases remained important parts of its portfolio. Its oncology pipeline also faced a setback: GSK ended development of the anti-TIGIT antibody belrestotug in May 2025 after interim Phase 2 results failed its criteria for further development.
AstraZeneca continued to be anchored by oncology. Tagrisso and Imfinzi remained core growth drivers, while its antibody-drug conjugate strategy, including Enhertu, expanded its footprint. In late September 2025, AstraZeneca and Daiichi Sankyo reported positive Phase 3 DESTINY-Breast05 results in high-risk HER2-positive early breast cancer, with full data presented at ESMO in October.
Eli Lilly, while not the top performer, remained among the strongest with a 36.0% price gain. Demand for incretin therapies and development of its metabolic pipeline remained central to its business. On December 1, the final observation date, Lilly announced a further price reduction for Zepbound single-dose vials via LillyDirect. That announcement alone cannot explain the preceding months of gains.
Middle of the Pack: Double-Digit Gains
Novartis, Amgen and AbbVie delivered double-digit price gains of 32.8%, 30.2% and 25.5%, respectively. Roche gained 36.0% and ranked just above Lilly using unrounded returns. The price changes show relative performance but do not, by themselves, measure operating execution or explain investor expectations.
Underperformers: Portfolio and Strategic Developments
On the opposite end, Bristol Myers Squibb and Novo Nordisk stand out as notable underperformers.
Bristol Myers Squibb faced a late-decade loss-of-exclusivity cycle involving Eliquis, Opdivo and Pomalyst. The timing differs by medicine and geography: its 2024 annual report described expected U.S. Pomalyst generic entry no earlier than Q1 2026 and settled Eliquis generic launches in 2028, subject to further challenges. These risks are distinct from competition already occurring during the measured period.
Novo Nordisk experienced the sharpest decline in the group. During 2025, it announced a CEO transition and plans to reduce its workforce by approximately 9,000 positions. Pfizer completed its acquisition of Metsera in November. On November 24, Novo reported that oral semaglutide had not demonstrated superiority over placebo on the Alzheimer's disease progression endpoint in evoke and evoke+. These events occurred during the price window, but the comparison does not isolate their individual effects on the stock.
Takeaway
The 2025 performance dispersion highlights substantial differences across large pharma: eight of the thirteen securities gained more than 25%, while three declined. Portfolio strength, clinical milestones and exclusivity risks help frame further analysis, but price returns alone do not establish a company's valuation or the reasons for its performance.